Visma Data Connector
Visma's data connector streamlines the integration process between various financial tools and platforms, ensuring seamless data flow and accurate financial reporting for businesses of all sizes.


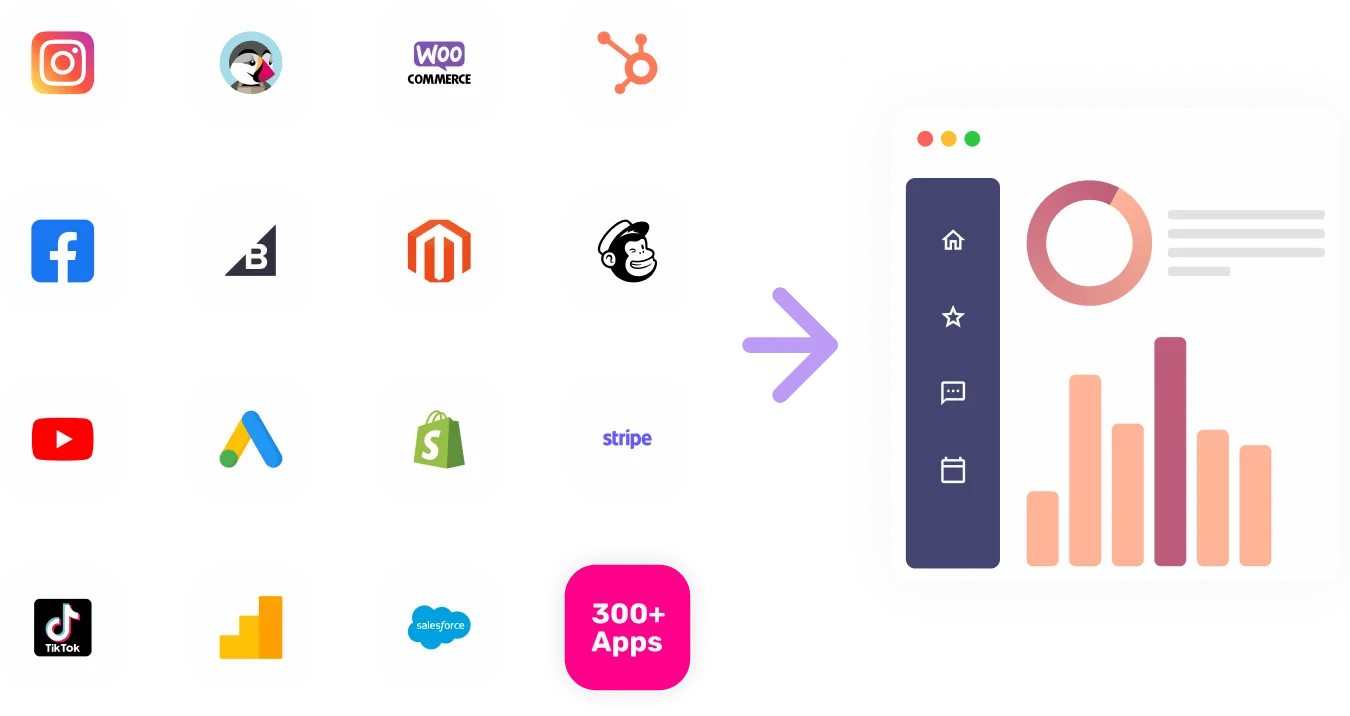
Visualize Your Visma channel data with Growth Nirvana's Visma Connector
The data connector by Visma enables users to effortlessly sync financial data across different applications, eliminating the need for manual data entry and reducing the risk of errors. By automating the data integration process, businesses can save time and resources while gaining valuable insights into their financial performance.
FAQs
What are the most popular metrics in Visma to analyze?
Revenue Growth: Track the growth of revenue over time and identify key factors influencing financial success.
Expense Analysis: Evaluate expenses across different categories to optimize spending and improve budgeting strategies.
Profit Margin: Monitor profit margins to assess the overall financial health and profitability of the business.
Cash Flow Forecasting: Predict future cash flows based on historical data and make informed financial decisions.
Account Receivables Turnover: Measure how efficiently the business collects outstanding receivables to improve cash flow management.
Why analyze Visma?
Financial Performance Evaluation: By analyzing these key metrics, businesses can gain a comprehensive understanding of their financial performance and make data-driven decisions to drive growth.
Strategic Planning: Insights from financial data analysis can help businesses develop effective strategies for long-term success and sustainability.
Risk Management: Identifying and monitoring key financial metrics can aid in mitigating risks and improving financial stability.
Performance Benchmarking: Comparing financial metrics with industry benchmarks can help businesses assess their competitive position and identify areas for improvement.
