Luma Data Connector
The Luma data connector is a powerful tool that seamlessly integrates with your existing marketing tools and provides a comprehensive view of your event performance. With this connector, you can easily track and analyze key metrics, enabling you to make data-driven decisions and optimize your event marketing strategies.


Visualize Your Luma channel data with Growth Nirvana's Luma Connector
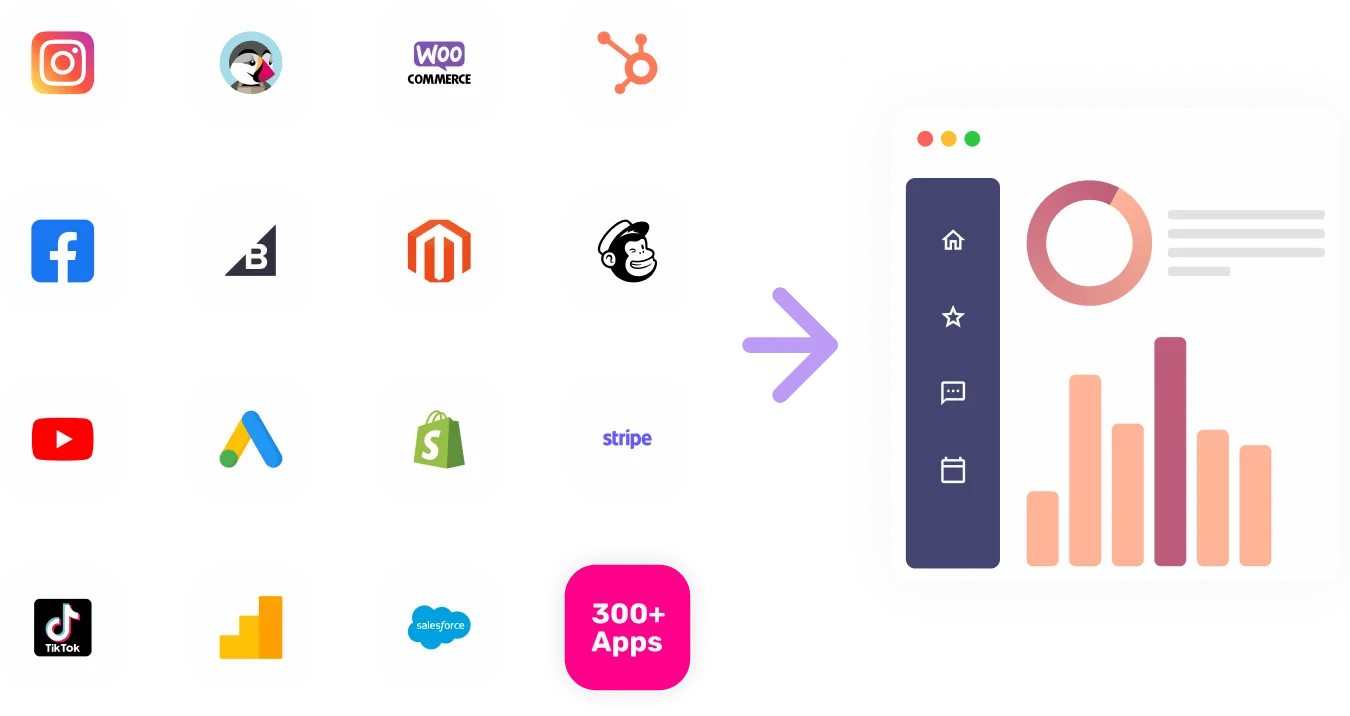
The Luma data connector takes event management to the next level by offering advanced analytics and reporting capabilities. It centralizes data from various sources, including ticketing platforms, social media channels, email marketing tools, and more, providing you with a holistic overview of your event's performance. With this detailed information at your fingertips, you can identify trends, spot areas for improvement, and make informed decisions to drive the success of your events.
FAQs
What are the most popular metrics in Luma to analyze?
Attendance Breakdown: Analyze the breakdown of attendees by demographics, location, and ticket types.
Social Media Reach: Measure the impact of your event's social media campaigns by tracking reach, engagement, and impressions.
Email Campaign Performance: Monitor the success of your email marketing efforts by tracking metrics such as open rates, click-through rates, and conversions.
Ticket Sales Analysis: Evaluate ticket sales performance, including revenue, ticket types, and conversion rates.
On-site Engagements: Track on-site engagements, such as session attendance, booth visits, and workshop participation.
Event App Engagement: Measure the adoption and engagement with your event app, including the number of downloads, active users, and in-app activities.
Why analyze Luma?
Better Resource Allocation: By analyzing the metrics provided by Luma, you can identify the most effective marketing channels and allocate your resources accordingly, maximizing your return on investment.
Audience Insights: Understanding your event attendees' demographics, preferences, and behavior allows you to tailor your marketing strategies to effectively reach and engage them.
Optimized Event Experience: Analyzing on-site engagements and event app metrics helps you optimize the event experience, making it more personalized and enjoyable for attendees.
Improved ROI: By tracking ticket sales, analyzing social media reach, and measuring email campaign performance, you can optimize your marketing efforts to increase ticket sales and improve your event's return on investment.
Data-Driven Decision Making: Luma's data connector empowers you to make informed decisions based on real-time, accurate data, ensuring that your event strategies are backed by insights and not guesswork.
