Looker Data Connector
The Looker Source data connector is a powerful tool that seamlessly integrates Looker, a business intelligence platform, with external data sources. This connector allows you to effortlessly import data from a wide range of sources to gain valuable insights and drive data-informed decision-making.


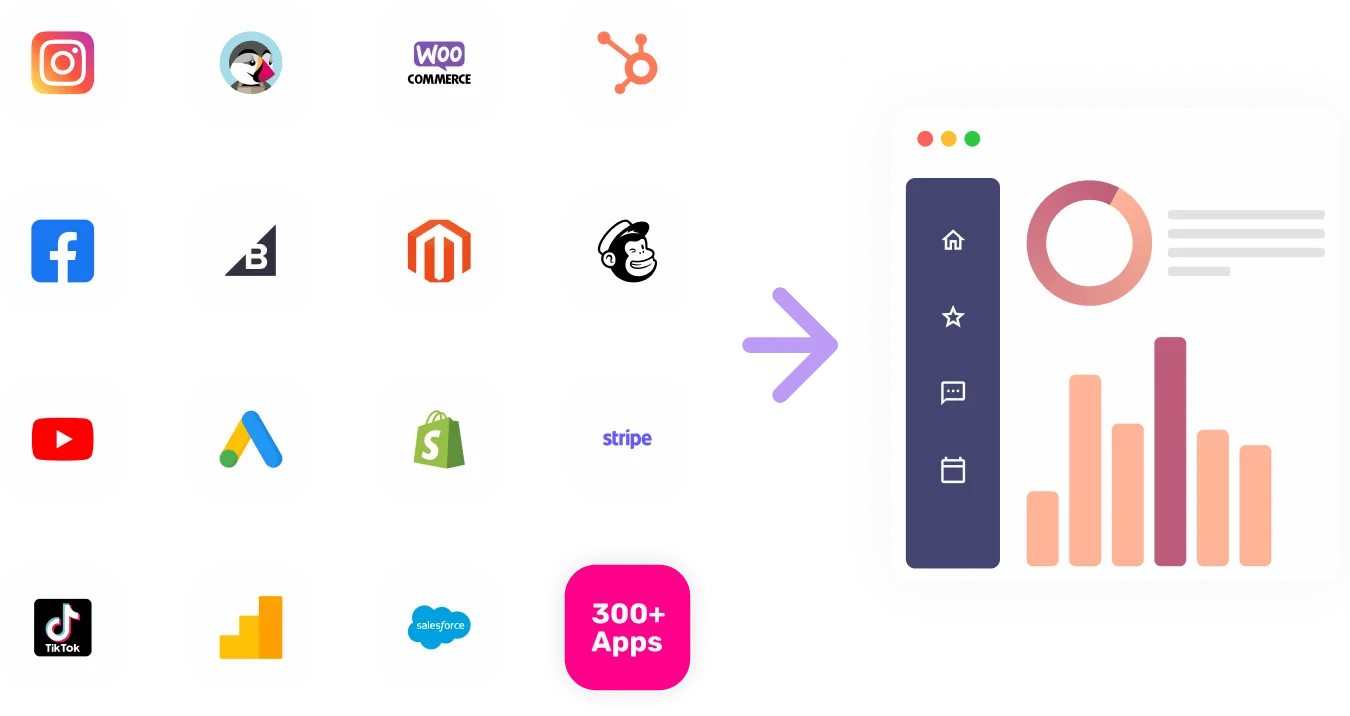
Visualize Your Looker channel data with Growth Nirvana's Looker Connector
With the Looker Source data connector, you can easily connect Looker to your engineering applications and extract valuable engineering data. This connector enables you to import and analyze critical engineering metrics, helping you to streamline your engineering processes, identify bottlenecks, and optimize resource allocation. By integrating Looker with your engineering tools, you can gain a comprehensive view of your engineering operations and make data-driven decisions to improve efficiency and productivity.
FAQs
What are the most popular metrics in Looker to analyze?
Engineering Efficiency: Measure and optimize the efficiency of your engineering team and processes.
Bug Resolution Time: Track the time taken to resolve bugs and identify areas for improvement.
Code Quality: Analyze code quality metrics such as complexity and maintainability.
Deployment Frequency: Monitor how often your engineering team deploys changes to production.
Test Coverage: Measure the extent to which your code is tested and identify gaps.
Sprint Velocity: Track the speed and progress of your engineering team during sprints.
Uptime and Downtime: Monitor the availability and performance of your engineering systems.
Resource Utilization: Analyze and optimize the utilization of engineering resources.
Why analyze Looker?
Efficient Resource Allocation: By analyzing engineering metrics, you can identify areas where resources can be allocated more effectively, enabling you to improve productivity.
Continuous Improvement: Tracking metrics such as bug resolution time and code quality allows you to continuously improve your engineering processes for enhanced overall performance.
Optimized Deployment Process: Monitoring deployment frequency and sprint velocity helps you optimize your deployment process for faster and smoother releases.
Improved Stability and Performance: By analyzing metrics related to uptime and downtime, you can proactively identify and address issues, ensuring optimal system stability and performance.
Enhanced Collaboration: Utilizing engineering metrics provides valuable insights that foster better collaboration and communication across your engineering team.
