Azure DevOps Data Connector
Enhance Collaboration and Development with Azure DevOps Integration. Seamlessly connect development, deployment, and monitoring processes for efficient software lifecycle management.


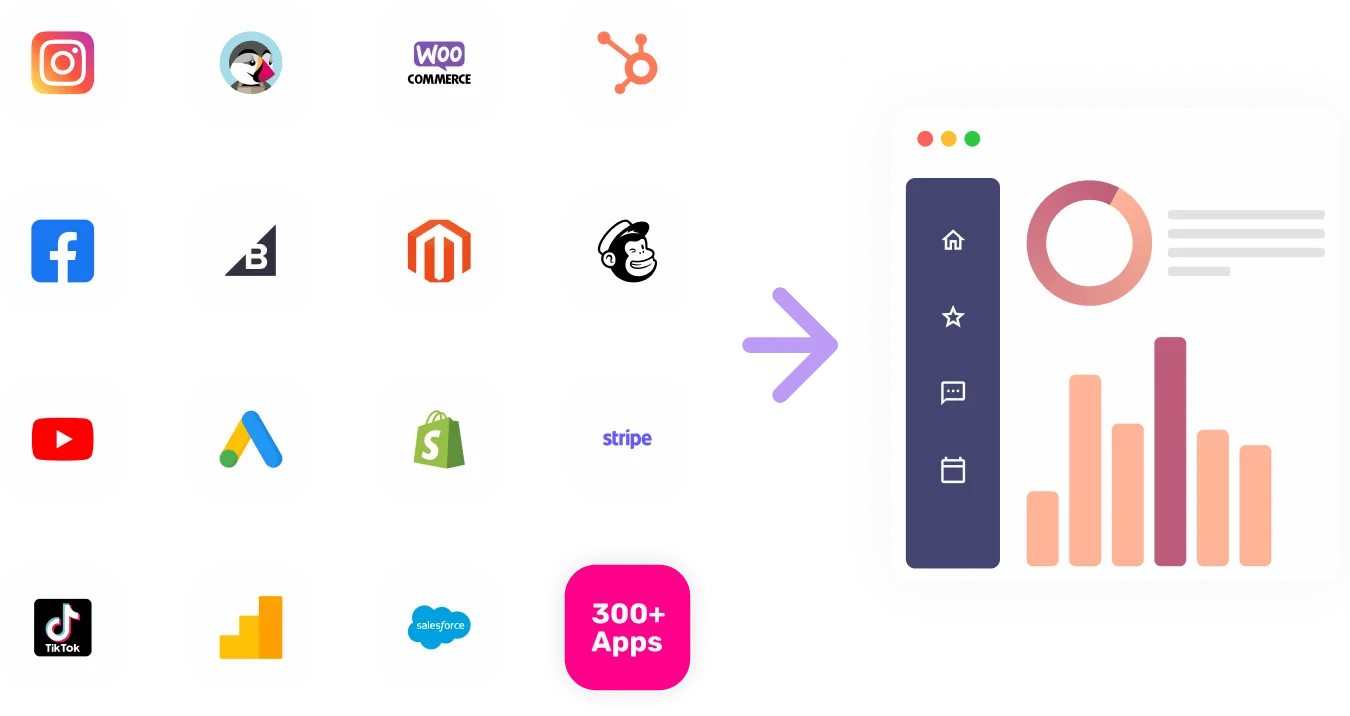
Visualize Your Azure DevOps channel data with Growth Nirvana's Azure DevOps Connector
Empower Collaboration and Development with Azure DevOps Integration. Streamline software development, automate workflows, and achieve seamless deployment and monitoring.
FAQs
What are the Most Popular Metrics in Azure DevOps to Analyze?
Cycle Time: Measure the time taken for a work item to transition from start to completion.
Lead Time: Assess the time taken from the creation of a work item to its deployment.
Deployment Frequency: Evaluate how frequently deployments occur within your development pipeline.
Change Failure Rate: Measure the percentage of deployments that result in failures.
Release Burndown: Track the progress of releases and identify potential delays.
Code Churn: Analyze the rate of code changes and its impact on development velocity.
Backlog Health: Assess the health and status of your work item backlog.
Bug Resolution Time: Measure the time taken to resolve reported bugs or issues.
Test Coverage: Evaluate the extent to which your codebase is covered by automated tests.
Code Review Efficiency: Assess the efficiency and effectiveness of code review processes.
Why Analyze Azure DevOps?
Streamlined Development: Accelerate software development with seamless integration of tools and processes.
Efficient Workflows: Automate and optimize development workflows for increased productivity.
Continuous Improvement: Identify areas for improvement and optimize development practices.
Data-Driven Insights: Gain actionable insights into development processes and performance.
Enhanced Collaboration: Facilitate cross-functional collaboration among development teams.
Faster Time to Deployment: Reduce deployment time and achieve quicker time-to-market.
Quality Assurance: Ensure code quality and reliability through comprehensive testing.
Issue Resolution: Identify and address issues promptly for efficient development cycles.
Transparent Development: Provide stakeholders with transparency into development progress and outcomes.
Strategic Decision-Making: Make informed decisions based on data-driven development insights.
