
Sync Statistics Netherlands CBS to BigQuery
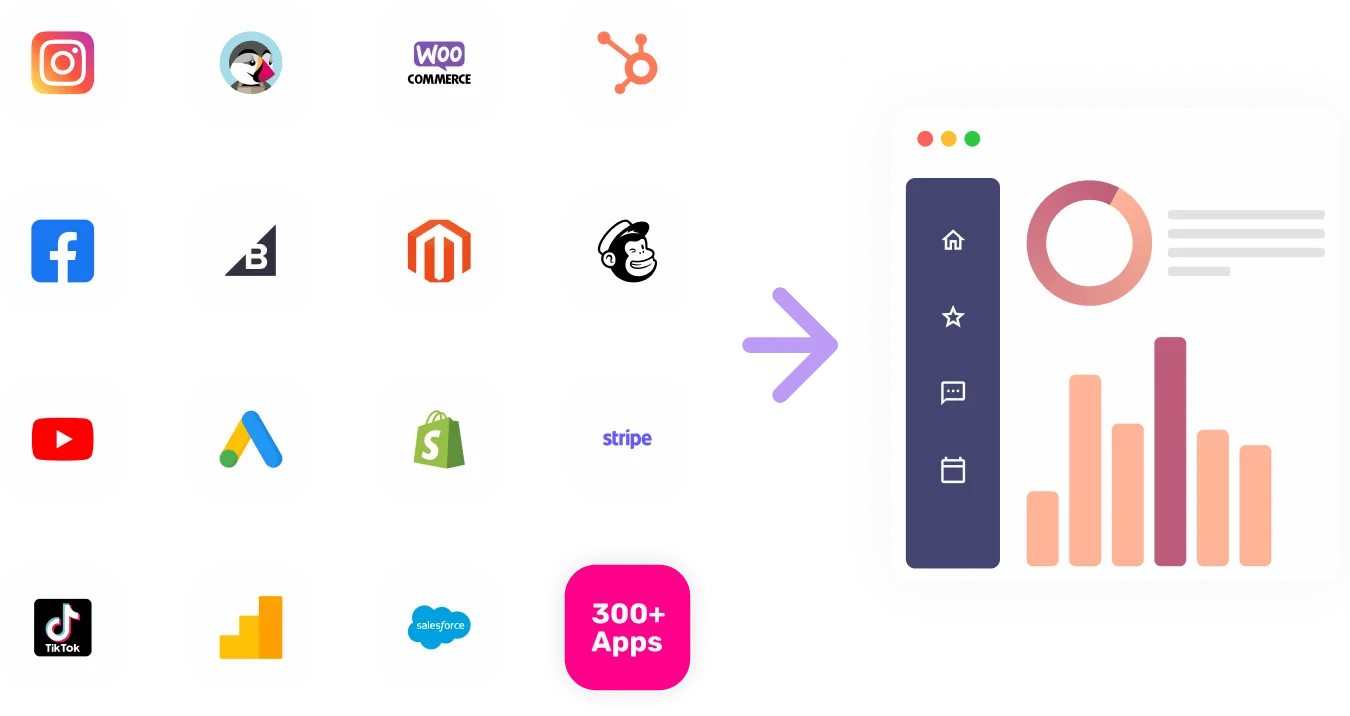
The Statistics Netherlands CBS data connector is a powerful tool that allows you to seamlessly integrate Dutch national statistical data into your preferred marketing platform, enabling you to make data-driven decisions and optimize your marketing strategies with accurate insights.


Visualize Your Statistics Netherlands CBS channel data with Growth Nirvana's Statistics Netherlands CBS Connector
With the Statistics Netherlands CBS data connector, you can access a comprehensive range of statistical information curated by the Dutch national statistical institute. This includes data on population demographics, economic indicators, consumer behavior trends, industry performance, and more. By integrating this data into your marketing platform, you can gain valuable insights into the Dutch market landscape, identify growth opportunities, and tailor your campaigns to target specific audience segments effectively.
FAQs
What are the most popular metrics in Statistics Netherlands CBS to analyze?
Population Demographics: Gain a detailed understanding of the demographic makeup of the Dutch population to refine your target audience strategies.
Economic Indicators: Track key economic metrics such as GDP, inflation rates, and employment levels to adapt your marketing efforts to market conditions.
Consumer Behavior Trends: Monitor consumer preferences, spending patterns, and purchasing behaviors to optimize your product offerings and marketing messages.
Industry Performance: Stay updated on industry-specific data to benchmark your performance, identify competitive trends, and capitalize on market opportunities.
Why analyze Statistics Netherlands CBS?
Market Segmentation: Enhance your market segmentation strategies by leveraging demographic and behavioral data insights for more targeted marketing campaigns.
Competitive Analysis: Benchmark your performance against industry trends and competitor data to identify strengths, weaknesses, and areas for improvement.
Trend Forecasting: Anticipate market shifts and consumer trends by analyzing historical data and emerging patterns to stay ahead of the curve.
Performance Optimization: Optimize your marketing strategies by making data-driven decisions based on accurate statistical insights to maximize ROI and campaign effectiveness.
