
Sync Splash to Spreadsheets
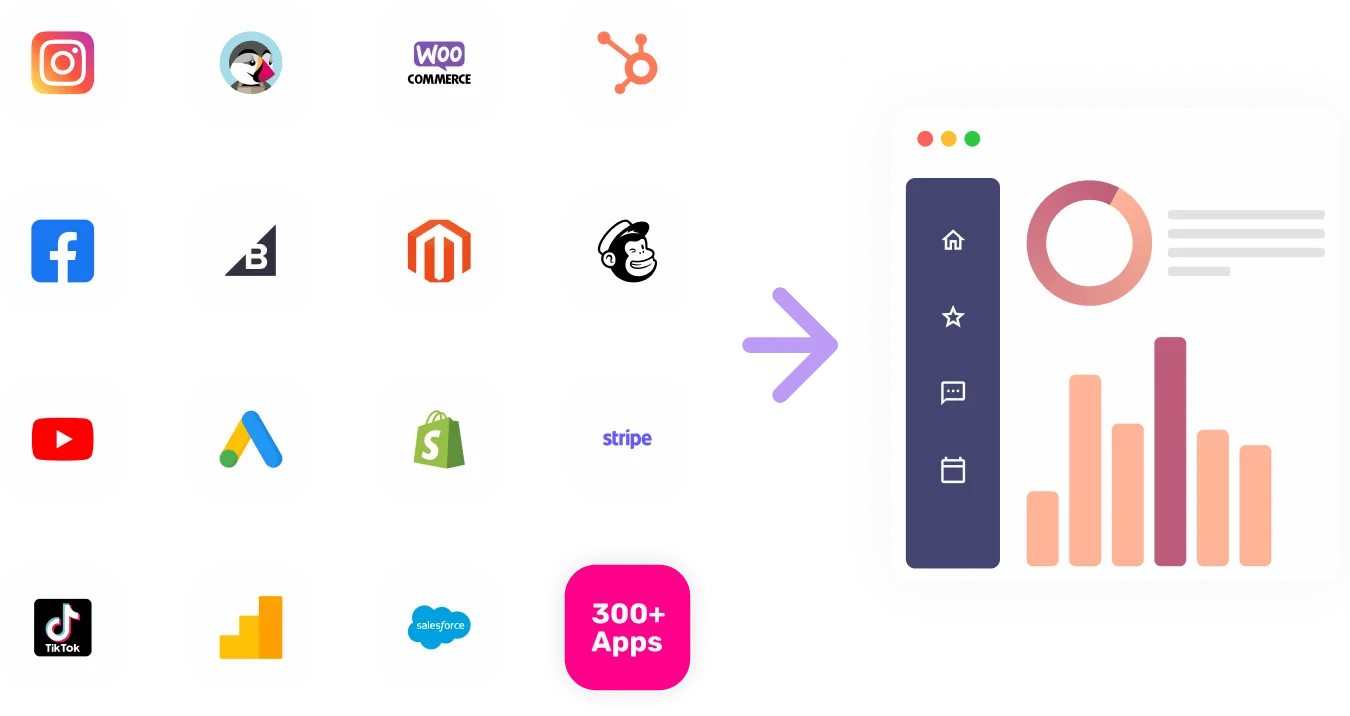
The Splash data connector seamlessly integrates with your existing marketing analytics tools to provide a comprehensive view of your event marketing performance. By consolidating data from Splash events, you can track key metrics and optimize your marketing strategies for better results.


Visualize Your Splash channel data with Growth Nirvana's Splash Connector
With the Splash data connector, you can effortlessly sync event data with your analytics platform in real-time. Gain valuable insights into attendee engagement, conversion rates, and event ROI. The connector simplifies the process of analyzing event performance and enables data-driven decision-making to enhance your event marketing efforts.
FAQs
What are the most popular metrics in Splash to analyze?
Attendee Engagement: Measure the level of interaction and interest from attendees during events to gauge overall success.
Conversion Rates: Track the percentage of event attendees who take a desired action, such as signing up for a newsletter or making a purchase.
ROI: Calculate the return on investment generated from events by comparing costs to the revenue or leads generated.
Event Attendance: Monitor the number of attendees at each event to assess popularity and identify opportunities for growth.
Social Media Reach: Evaluate the reach and impact of event-related social media posts to maximize online visibility and engagement.
Why analyze Splash?
Targeted Marketing: Utilize event data insights to tailor marketing campaigns to specific audience segments for improved targeting and personalization.
Optimized Campaigns: By analyzing key metrics, you can identify successful strategies and areas for improvement to optimize future event marketing campaigns.
Maximized ROI: Understanding event performance metrics allows you to allocate resources more effectively, leading to a higher return on investment and overall profitability.
