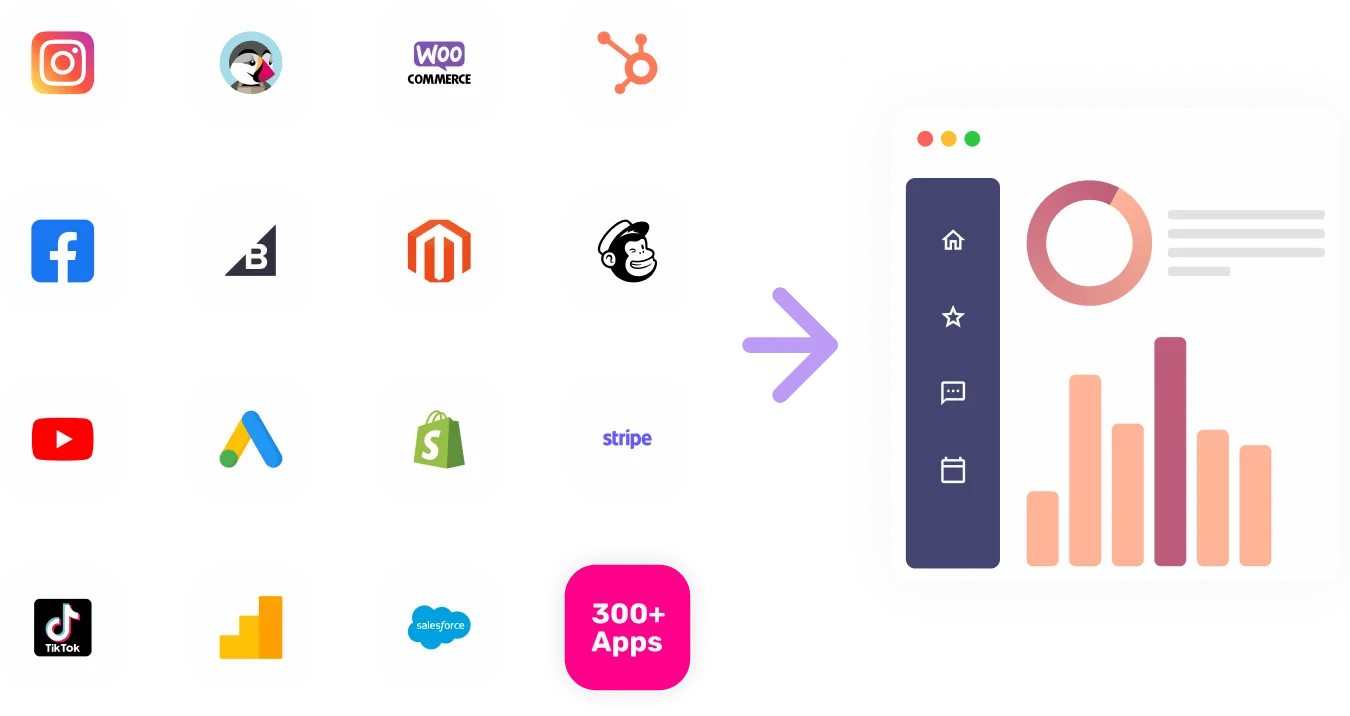

Sync Simplesat to Redash
The data connector for Simplesat allows you to seamlessly integrate customer feedback and survey data into your existing systems and workflows.


Visualize Your Simplesat channel data with Growth Nirvana's Simplesat Connector
With the Simplesat data connector, you can easily collect, analyze, and utilize customer feedback and survey data to make data-driven decisions and improve your customer support processes. By connecting Simplesat with your preferred tools and platforms, you can streamline your feedback management and gain valuable insights into customer satisfaction in real-time.
FAQs
What are the most popular metrics in Simplesat to analyze?
Response Rates: Measure the percentage of customers who respond to your surveys to gauge the overall engagement level of your customer base.
Net Promoter Score (NPS): Track the loyalty and satisfaction of your customers by calculating the NPS to identify promoters, passives, and detractors.
Customer Satisfaction (CSAT): Monitor the satisfaction level of individual interactions or touchpoints to identify areas for improvement and optimize your support.
Average Resolution Time: Measure the time it takes to resolve customer issues to identify bottlenecks and improve the efficiency of your support team.
Ticket Volume: Track the number of tickets or support requests received to analyze trends and allocate resources effectively.
Why analyze Simplesat?
Data-Driven Decision Making: Accessing and analyzing customer feedback and survey data allows you to make informed decisions to enhance your customer support strategies and establish a customer-centric approach.
Continuous Improvement: By analyzing the metrics provided by Simplesat, you can pinpoint areas that require improvement, identify patterns and trends, and implement changes to enhance the overall customer experience.
Enhanced Customer Engagement: Understanding customer sentiment, satisfaction, and loyalty helps your team tailor support interactions, deliver personalized experiences, and boost customer engagement and retention.
Optimized Support Processes: Analyzing metrics such as average resolution time and ticket volume enables you to identify inefficiencies, streamline support processes, and improve the productivity of your support team.
