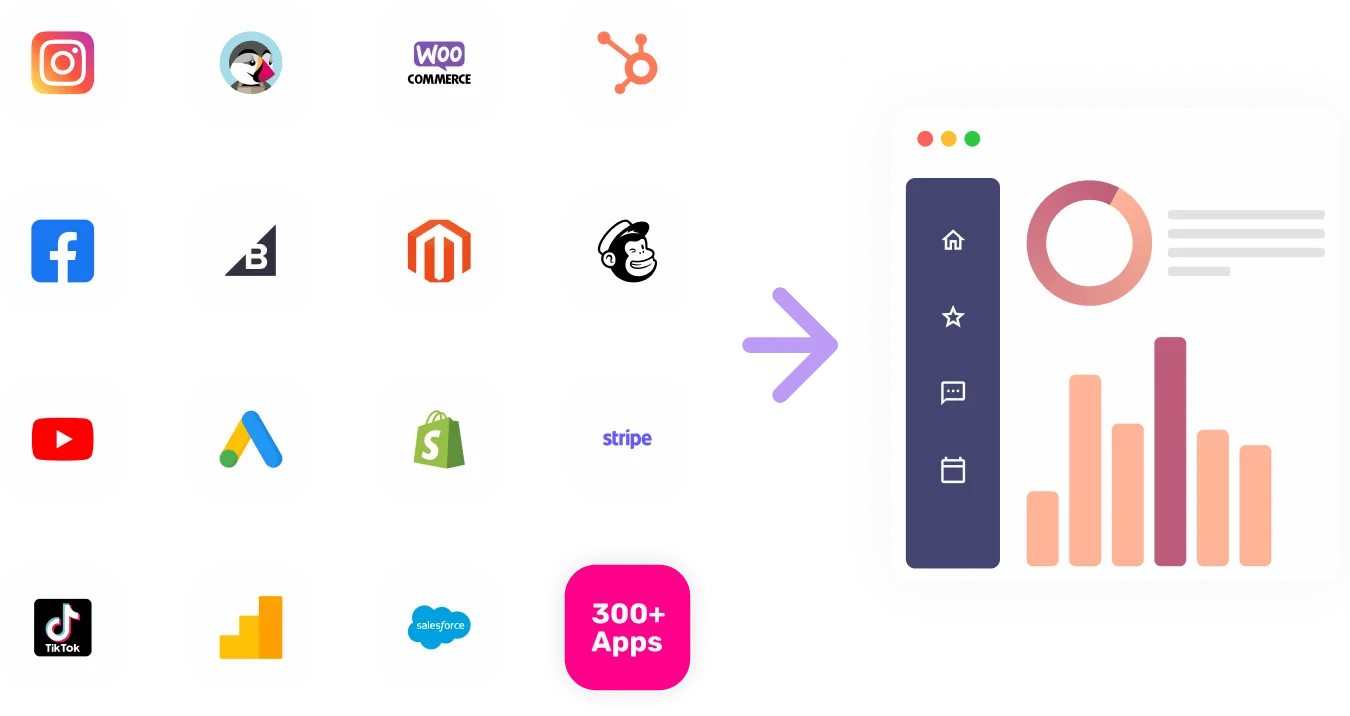

Sync Retently to Power BI
Enhance your customer feedback insights with Retently integration. Seamlessly merge customer data, unlocking insights that shape product strategies, customer analysis, and operational excellence.


Visualize Your Retently channel data with Growth Nirvana's Retently Connector
Amplify your customer feedback strategies with Retently integration, gaining actionable insights from customer data analysis.
FAQs
What are the most popular metrics in Retently to analyze?
Customer Satisfaction: Assess customer satisfaction levels and sentiment analysis.
Net Promoter Score: Measure customer loyalty and advocacy with the Net Promoter Score.
Churn Rate: Evaluate customer retention and identify churn patterns.
Survey Response Rates: Analyze the percentage of customers who respond to feedback surveys.
Feedback Analysis: Assess the effectiveness of feedback collection methods.
Trends and Patterns: Identify trends and patterns in customer feedback to drive improvements.
Segmentation Insights: Gain insights on customer segments and their feedback preferences.
Feedback Actionability: Evaluate the actionability of customer feedback for process improvements.
Competitor Analysis: Gain competitive insights from customer feedback on competing products or services.
Customer Experience Optimization: Optimize the customer experience based on feedback insights.
Why analyze Retently?
Product Strategy: Refine product strategies based on data-driven insights from customer feedback.
Customer Analysis: Gain deeper understanding of customer behavior, preferences, and needs.
Retention Improvement: Identify opportunities to improve customer retention rates.
Feedback Collection: Optimize methods for collecting feedback and increasing response rates.
Feedback Actionability: Make customer feedback more actionable for process improvements.
Trend Identification: Identify trends and patterns in customer feedback to drive improvements.
Segmentation Optimization: Optimize customer segmentation strategies for better targeting.
Process Improvement: Drive process improvements based on customer feedback insights.
Competitor Analysis: Gather insights from customer feedback on competitors' products or services.
Customer Experience Enhancement: Enhance the overall customer experience based on feedback insights.
