
Sync myosh to Tableau
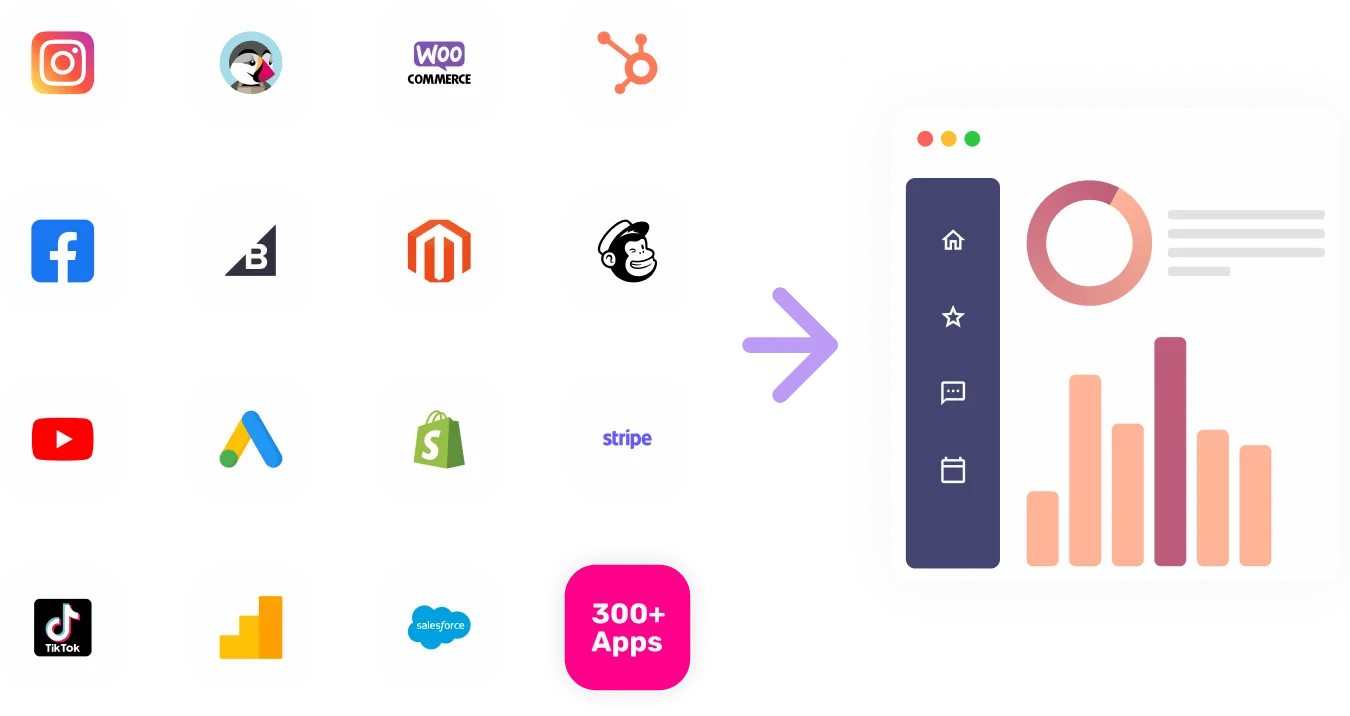
The myosh data connector is a powerful tool that seamlessly integrates with your workplace safety software to provide real-time data insights and analytics.


Visualize Your myosh channel data with Growth Nirvana's myosh Connector
By connecting your myosh app with the data connector, you can streamline your safety management processes and improve decision-making by leveraging advanced analytics and reporting functionalities. This connector allows you to easily track and monitor key safety metrics, identify trends, and proactively address potential safety issues before they escalate.
FAQs
What are the most popular metrics in myosh to analyze?
Incident Rates: Track and analyze the frequency and severity of workplace incidents to pinpoint areas for improvement and enhance safety protocols.
Training Compliance: Monitor employee training completion rates to ensure compliance with safety protocols and regulations.
Risk Assessments: Evaluate and mitigate potential risks in the workplace by analyzing risk assessment data and implementing preventive measures.
Safety Culture Survey Results: Gather feedback from safety culture surveys to gauge employee perceptions and identify areas for enhancing safety culture.
Emergency Response Times: Measure and optimize the efficiency of emergency response procedures by analyzing response times and identifying bottlenecks.
Near Miss Reports: Capture and analyze near miss incidents to prevent future accidents and promote a proactive safety culture.
Why analyze myosh?
Data-Driven Decision Making: By analyzing key metrics, you can make informed decisions based on real-time data insights to improve workplace safety practices and prevent incidents.
Compliance Management: Ensure compliance with regulatory requirements and industry standards by monitoring and reporting on key safety metrics using the data connector.
Continuous Improvement: Identify areas for improvement through data analysis, enable proactive safety measures, and foster a culture of continuous safety enhancement within your organization.
