
Sync Loopio to Tableau
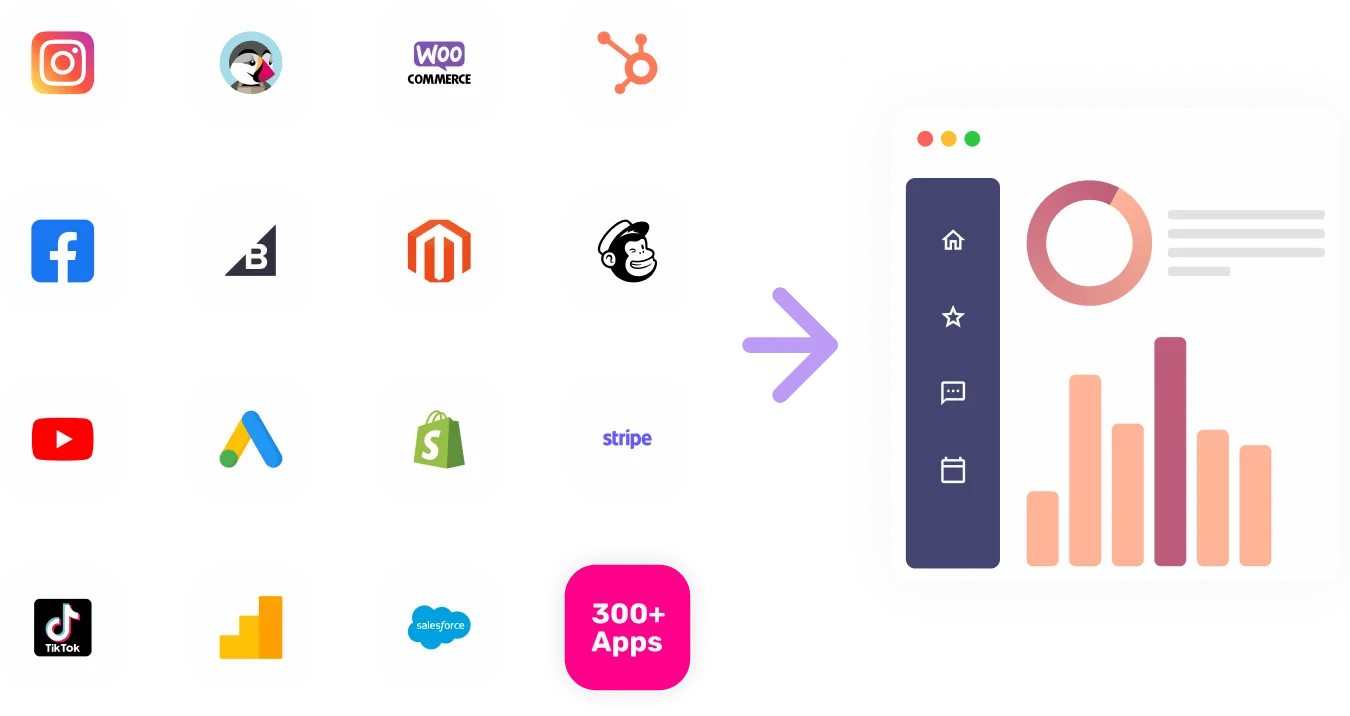
The Loopio Data Connector is a powerful tool that seamlessly integrates with the Loopio cloud-based request for proposal (RFP) solution. This connector allows users to efficiently access and analyze data from Loopio, enabling a greater level of productivity and informed decision-making.


Visualize Your Loopio channel data with Growth Nirvana's Loopio Connector
With the Loopio Data Connector, users can dive deep into the data generated within Loopio, gaining valuable insights and optimizing their RFP processes. This connector provides a comprehensive set of features, allowing users to track key metrics, generate custom reports, and analyze trends to streamline their RFP workflows. By leveraging the power of data, Loopio users can save time, improve collaboration, and win more RFPs.
FAQs
What are the most popular metrics in Loopio to analyze?
Request Completion Rate: Analyze the percentage of completed requests, identifying areas for improvement and increasing overall efficiency.
Response Time: Track the average time taken to respond to requests, ensuring timely and effective communication with clients.
Content Accuracy: Evaluate the accuracy of RFP content, minimizing errors and enhancing the quality of responses.
Win Rate: Measure the success rate of winning RFPs, enabling businesses to identify winning strategies and replicate them in future proposals.
Team Performance: Assess individual and team performance metrics, enabling insights into productivity and areas for development in the RFP process.
Why analyze Loopio?
Enhanced Efficiency: By analyzing key metrics, businesses can identify bottlenecks, optimize processes, and streamline RFP workflows, resulting in increased efficiency.
Data-Driven Decision-Making: The Loopio Data Connector empowers users to leverage data-driven insights to make informed decisions, enhancing the quality of responses and increasing the likelihood of winning RFPs.
Competitive Advantage: By tracking and analyzing key metrics, businesses can gain a competitive edge by understanding their strengths and areas for improvement, allowing them to continuously optimize their RFP strategies.
Continuous Improvement: Regularly analyzing metrics enables businesses to identify trends, spot patterns, and constantly improve their RFP processes, driving long-term success.
