
Sync Insightly to Tableau
Elevate Your Customer Relationship Management with Insightly Integration. Seamlessly connect and manage customer data, interactions, and insights, enhancing relationships and driving business growth.


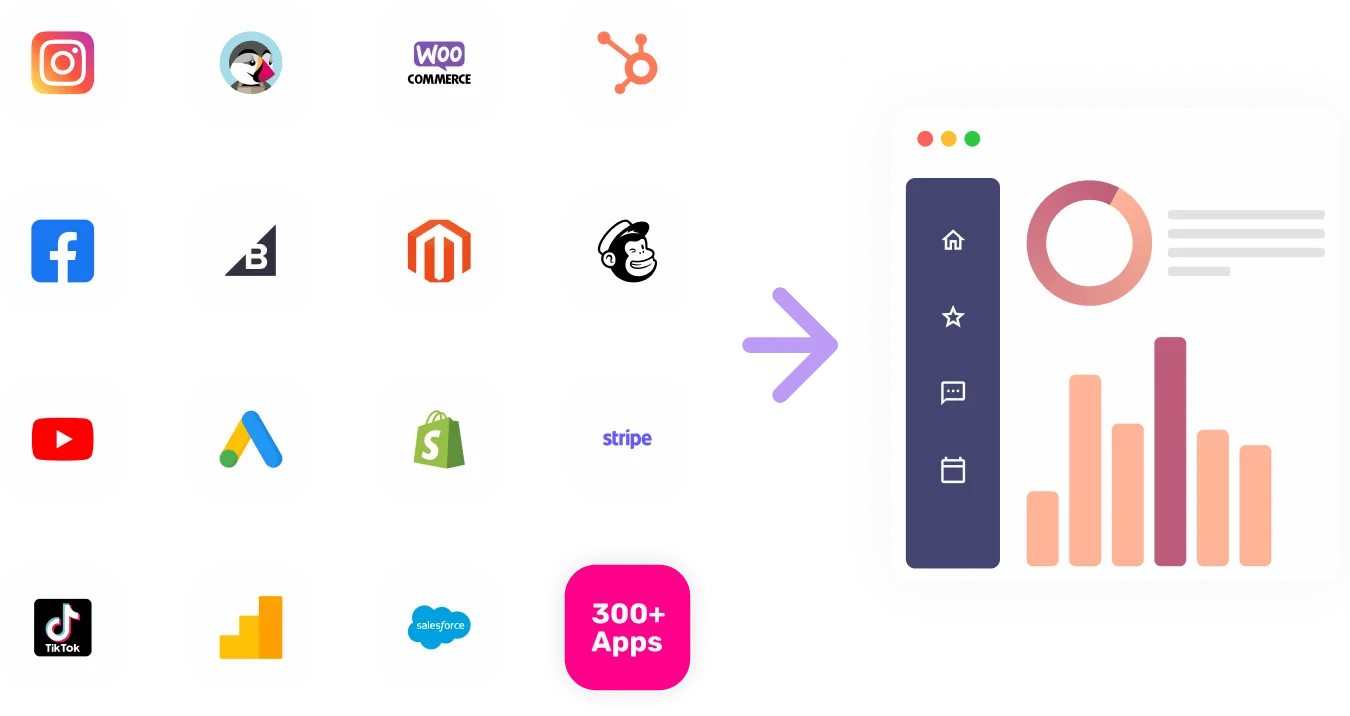
Visualize Your Insightly channel data with Growth Nirvana's Insightly Connector
Optimize Customer Relationships with Insightly Integration. Unlock a comprehensive view of customer interactions, streamline workflows, and make data-driven decisions for improved CRM strategies.
FAQs
What are the Most Popular Metrics in Insightly to Analyze?
Lead Conversion Rate: Evaluate the percentage of leads that convert into paying customers.
Sales Pipeline Velocity: Analyze the speed at which deals progress through the sales pipeline.
Customer Acquisition Cost (CAC): Calculate the cost of acquiring a new customer in relation to revenue generated.
Churn Rate: Measure the rate at which customers discontinue their relationships with your business.
Deal Close Rate: Assess the success rate of closing deals and winning new business.
Customer Lifetime Value (CLV): Determine the total value a customer generates during their engagement with your business.
Opportunity Win Rate: Analyze the percentage of sales opportunities that result in closed deals.
Sales Rep Performance: Evaluate individual sales representatives' performance and contribution.
Lead Engagement: Monitor and analyze lead interactions and engagement levels.
Activity and Engagement Trends: Identify patterns and trends in customer interactions and engagement over time.
Why Analyze Insightly CRM Data?
Informed Decision-making: Make strategic decisions based on insights into customer interactions and behaviors.
Enhanced Customer Relationships: Build stronger relationships by understanding customer needs and preferences.
Sales Performance Optimization: Optimize sales strategies and processes for improved deal closure rates.
Revenue Growth: Drive business growth by identifying and capitalizing on revenue opportunities.
Efficient Resource Allocation: Allocate resources effectively based on data-driven insights into customer engagement.
Customer Retention: Reduce churn and increase customer loyalty through tailored engagement.
Sales Team Accountability: Hold sales teams accountable and motivate performance improvement.
Lead Qualification: Qualify leads accurately to focus efforts on high-potential opportunities.
Continuous Improvement: Iteratively enhance CRM strategies based on real-time performance data.
Competitive Advantage: Stay ahead by leveraging insights for more effective customer engagement.
