
Sync Flexport to Power BI
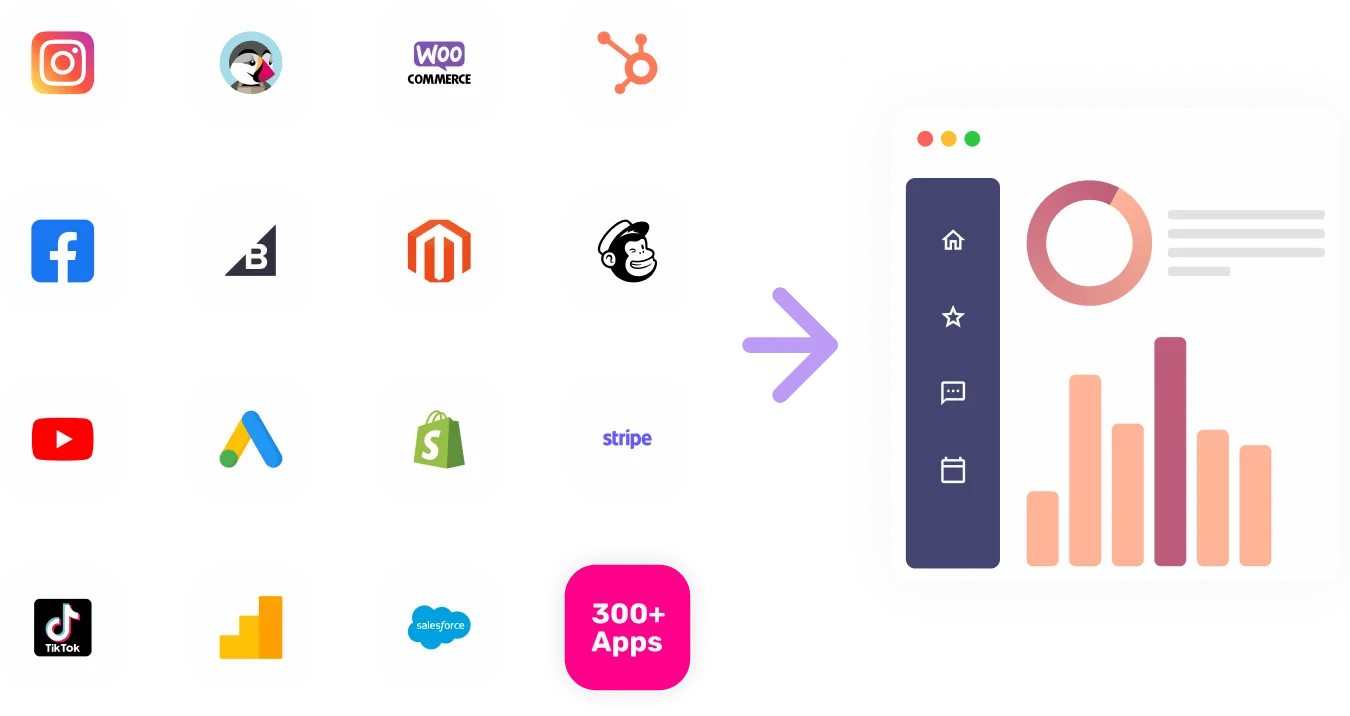
Integrate Flexport with your finance app using our robust data connector. Seamlessly sync freight forwarding and logistics data to gain valuable insights.


Visualize Your Flexport channel data with Growth Nirvana's Flexport Connector
Our data connector allows your finance app to directly connect with Flexport, streamlining the process of importing and analyzing freight forwarding and logistics data. With real-time data syncing, you can access accurate and up-to-date information to make informed financial decisions.
FAQs
What are the most popular metrics in Flexport to analyze?
On-time Delivery Rate: Evaluate the performance of freight forwarding and logistics operations by measuring the percentage of shipments delivered on time.
Cost per Shipment: Track the expenses associated with each shipment to assess profitability and identify cost-saving opportunities.
Freight Spend by Mode: Analyze the distribution of budget across different modes of transportation (air, sea, rail, etc.) to optimize cost and performance.
Shipment Volume by Region: Visualize the volume of shipments originating from or destined to different regions, helping you identify key markets and customer trends.
Customs Compliance Rate: Measure the compliance rate of customs documentation and processes to minimize potential risks and ensure smooth operations.
Inventory Holding Costs: Calculate the costs associated with holding inventory for accurate financial reporting and inventory management strategies.
Why analyze Flexport?
Improved Cost Management: Analyze your freight forwarding and logistics data to identify cost-saving opportunities, reduce expenses, and optimize your supply chain.
Enhanced Operational Efficiency: By monitoring key metrics, you can improve decision-making and streamline operations, leading to increased productivity and customer satisfaction.
Risk Mitigation: Identify potential risks and compliance issues in real-time, allowing you to take proactive measures and maintain a secure and compliant supply chain.
Strategic Planning: Leverage insights from data analysis to develop robust business strategies, expand into new markets, and gain a competitive edge.
