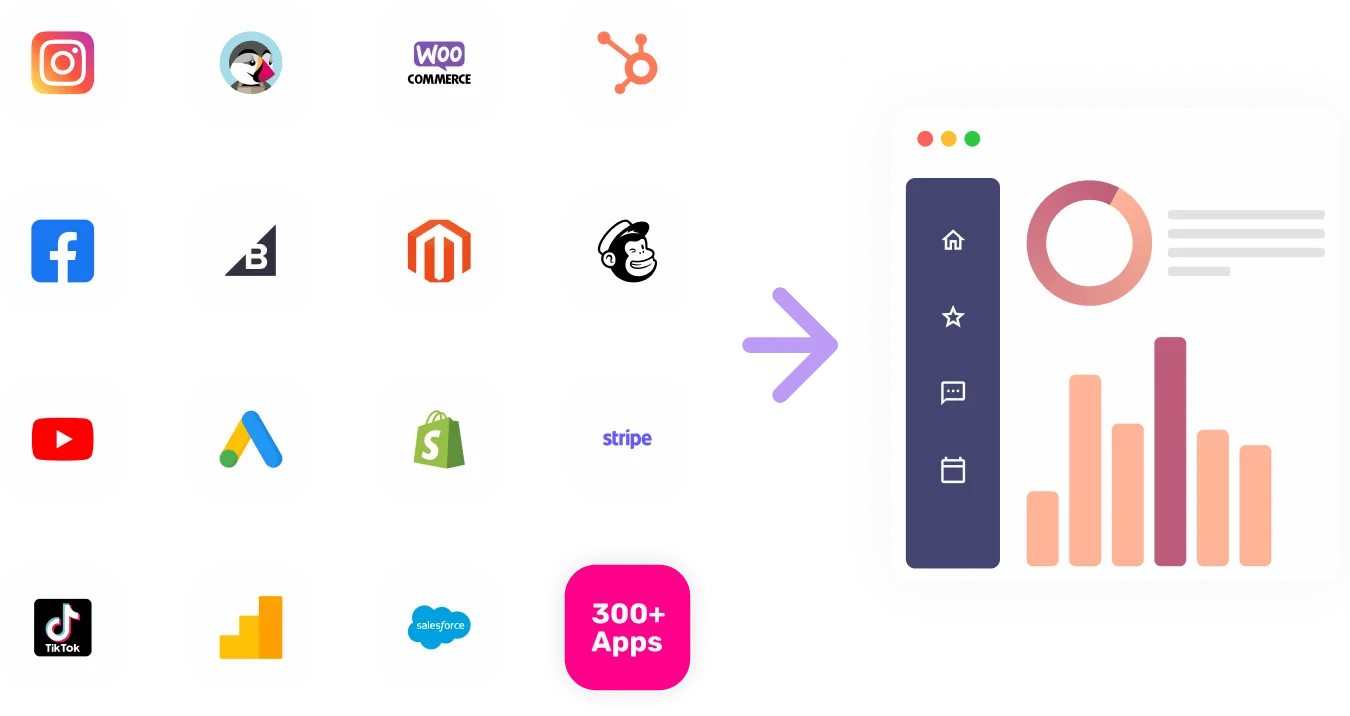

Sync DEAR to Power BI
Streamline Operations with DEAR Integration. Seamlessly integrate inventory and order data for efficient supply chain management, optimized processes, and enhanced business performance.


Visualize Your DEAR channel data with Growth Nirvana's DEAR Connector
Optimize Operations with DEAR Integration. Unlock the power of streamlined inventory management, data-driven order processing, and improved overall business efficiency.
FAQs
What are the Most Popular Metrics in DEAR to Analyze?
Inventory Turnover Ratio: Measure how many times your inventory is sold and replaced within a given period.
Order Fulfillment Cycle Time: Evaluate the time it takes to process an order from receipt to delivery.
Backorder Rate: Track the percentage of customer orders that cannot be fulfilled immediately due to lack of inventory.
Stockout Rate: Measure the frequency of running out of stock for specific items.
Lead Time: Assess the time between placing an order and receiving the inventory.
Order Accuracy: Evaluate the percentage of orders that are processed and delivered accurately.
Gross Profit Margin: Calculate the percentage of profit generated from sales after deducting the cost of goods sold.
Inventory Value: Track the total value of your inventory, including raw materials and finished products.
Supplier Performance: Analyze the reliability and efficiency of your suppliers in delivering inventory.
Sales by Product: Measure the revenue generated by each product or category within your inventory.
Why Analyze DEAR Data?
Efficient Supply Chain: Optimize your supply chain management for streamlined inventory processes.
Effective Order Processing: Improve order fulfillment and cycle times through data-driven insights.
Inventory Optimization: Reduce stockouts, backorders, and excess inventory with informed decision-making.
Improved Customer Satisfaction: Enhance customer experience by delivering accurate and timely orders.
Profitability Enhancement: Maximize profits through better inventory turnover and gross profit margins.
Supplier Relationship Management: Build stronger supplier partnerships based on performance analysis.
Strategic Decision-making: Make data-backed decisions for inventory management and business growth.
Financial Insights: Gain visibility into inventory value and its impact on your financial health.
Operational Excellence: Achieve operational efficiency and cost savings through optimized processes.
Business Scalability: Lay the foundation for scaling your business with streamlined operations.
