
Sync DCL Logistics to Snowflake
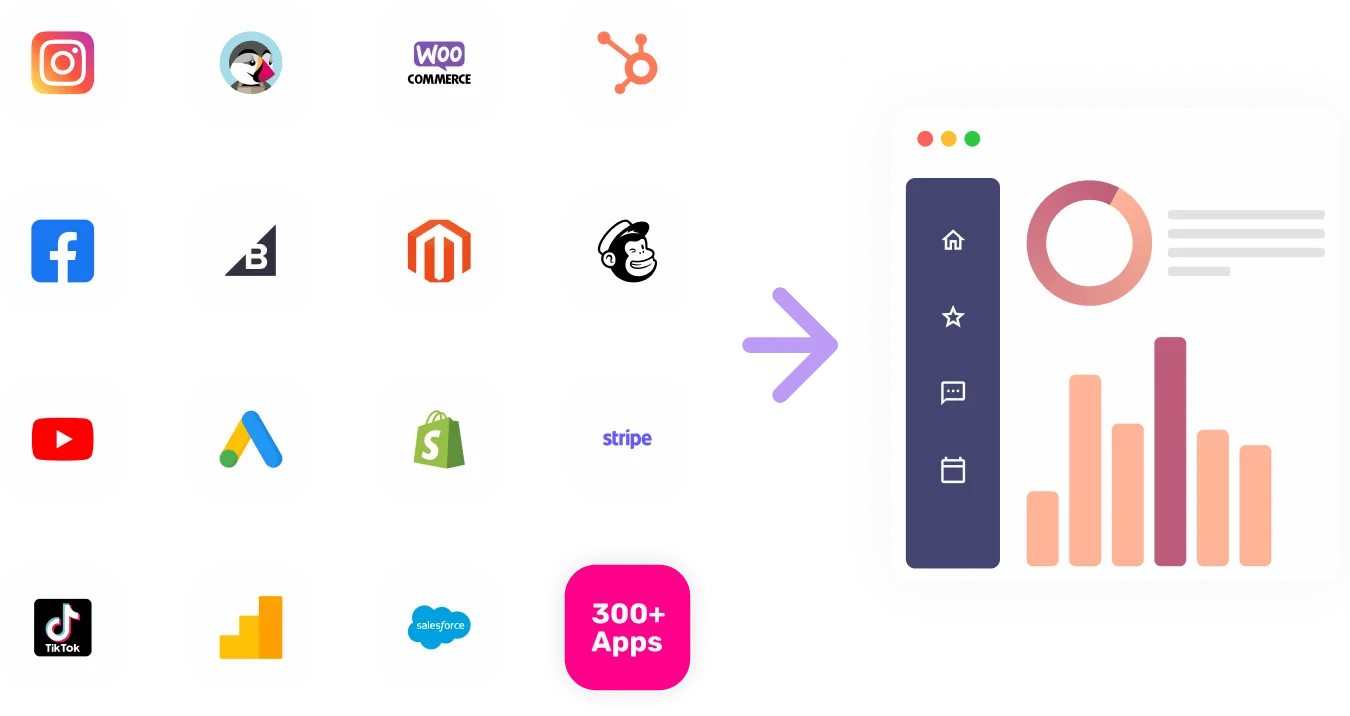
The DCL Logistics Data Connector is a powerful tool that integrates seamlessly with your existing logistics and supply chain management software. It allows you to centralize and analyze all your data in one place, providing you with valuable insights and improving productivity.


Visualize Your DCL Logistics channel data with Growth Nirvana's DCL Logistics Connector
With the DCL Logistics Data Connector, you can easily track and monitor all aspects of your logistics and supply chain operations. It pulls data from various sources, such as inventory management systems, order fulfillment platforms, and shipping carriers, and presents it in a unified dashboard. This enables you to gain a holistic view of your supply chain, identify bottlenecks, optimize processes, and make data-driven decisions to improve efficiency and reduce costs.
FAQs
What are the most popular metrics in DCL Logistics to analyze?
On-time Delivery Performance: Measure the percentage of orders that are delivered on time to evaluate the reliability of your logistics operations.
Inventory Turnover Ratio: Determine how quickly you are able to sell and replace your inventory to maximize profitability and prevent stockouts or overstocking.
Order Accuracy: Track the accuracy of your orders by measuring the percentage of orders that are fulfilled correctly, reducing the likelihood of returns and customer dissatisfaction.
Shipping Cost as a Percentage of Revenue: Analyze the cost-effectiveness of your shipping operations by calculating how much you spend on shipping compared to your total revenue.
Warehouse Utilization: Monitor the space utilization in your warehouse to optimize storage, layout, and inventory management, leading to increased efficiency and reduced costs.
Why analyze DCL Logistics?
Improved Supply Chain Visibility: By analyzing key metrics, you can gain insights into various stages of your supply chain and make informed decisions to improve visibility and control.
Optimized Operational Efficiency: Identifying inefficiencies and bottlenecks in your logistics processes allows you to optimize operations, reduce costs, and improve overall efficiency.
Enhanced Customer Satisfaction: By analyzing and improving metrics such as on-time delivery and order accuracy, you can provide a better customer experience and increase satisfaction levels.
Cost Reduction: Analyzing metrics like inventory turnover and shipping costs helps identify areas where costs can be reduced, contributing to improved profitability.
Strategic Decision Making: Accessing and analyzing real-time data enables you to make data-driven decisions that align with your business goals and strategies.
