
Sync Canny to BigQuery
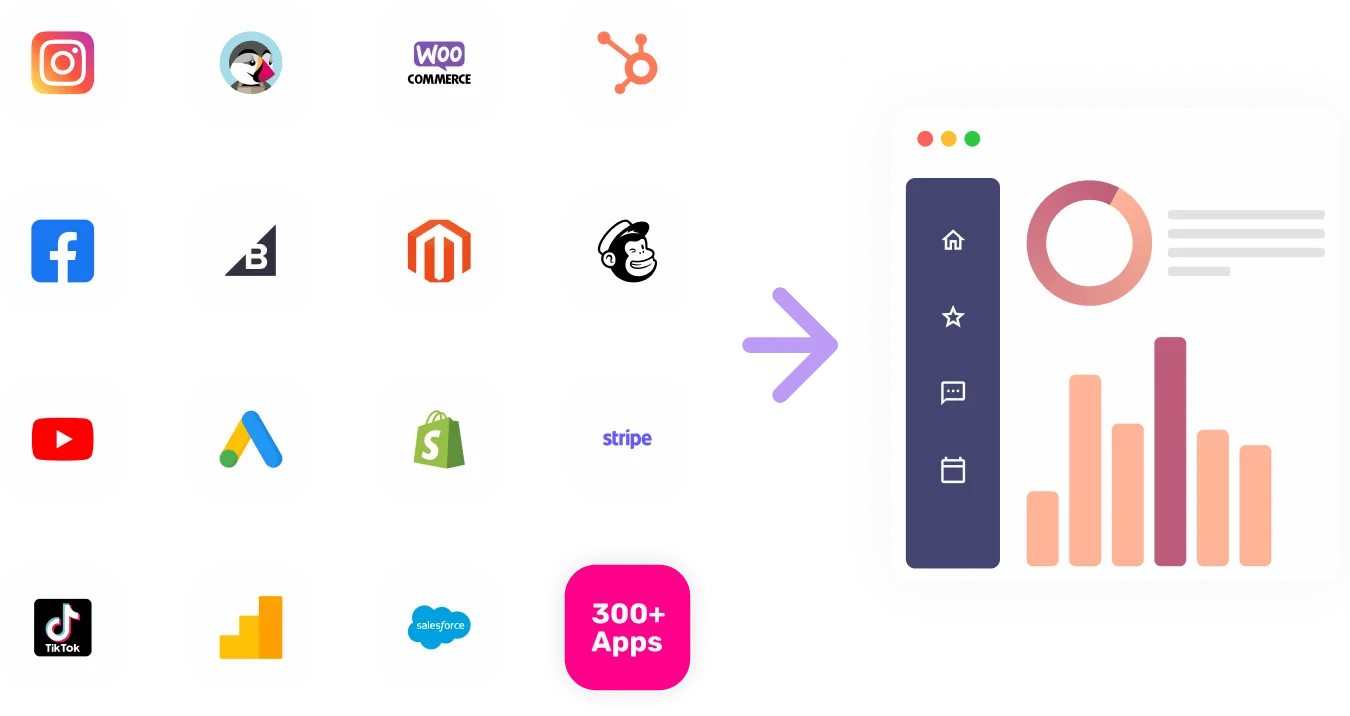
The Canny Data Connector is a powerful tool that allows you to seamlessly integrate customer feedback data with other engineering applications. By connecting Canny with your existing engineering systems, you can easily gather and analyze feedback to make informed decisions and drive product improvements.


Visualize Your Canny channel data with Growth Nirvana's Canny Connector
With the Canny Data Connector, you can streamline your customer feedback management process. It provides a centralized hub for collecting, organizing, and analyzing valuable customer insights. Seamlessly integrate Canny with your engineering tools and leverage its advanced features to enhance your decision-making capabilities. Whether you want to prioritize feature requests, track bug reports, or gather general feedback, the Canny Data Connector ensures you have access to the most up-to-date and relevant information.
FAQs
What are the most popular metrics in Canny to analyze?
Integration Efficiency: Measure how efficiently customer feedback is integrated into your engineering workflow.
Bug Resolution Time: Track the time taken to resolve reported bugs and measure your team's efficiency.
Feature Popularity: Understand which features are most requested by customers and prioritize their development.
Feedback Response Rate: Monitor the rate at which customer feedback is responded to and take action accordingly.
User Satisfaction: Gauge overall user satisfaction with your product by analyzing feedback sentiment and ratings.
Why analyze Canny?
Improved Product Development: By analyzing customer feedback, you can gain valuable insights to help guide your product development decisions. Identify pain points, understand customer needs, and deliver a product that exceeds expectations.
Enhanced User Experience: Analyzing metrics such as bug resolution time, feedback response rate, and user satisfaction allows you to proactively address issues and improve the overall user experience. Deliver a seamless and enjoyable experience for your customers.
Informed Decision-Making: Make data-driven decisions by utilizing insights derived from the analysis of customer feedback. Identify trends, uncover hidden patterns, and drive informed decision-making within your engineering team.
Increased Customer Engagement: Actively analyzing customer feedback ensures that you can respond to their needs and preferences. By delivering personalized experiences and tailored solutions, you can increase customer engagement and loyalty.
