
Sync Autodesk BIM 360 to Tableau
The Autodesk BIM 360 data connector is a cutting-edge tool that seamlessly integrates with the cloud-based construction management platform, allowing users to access, analyze, and visualize project data in real-time.


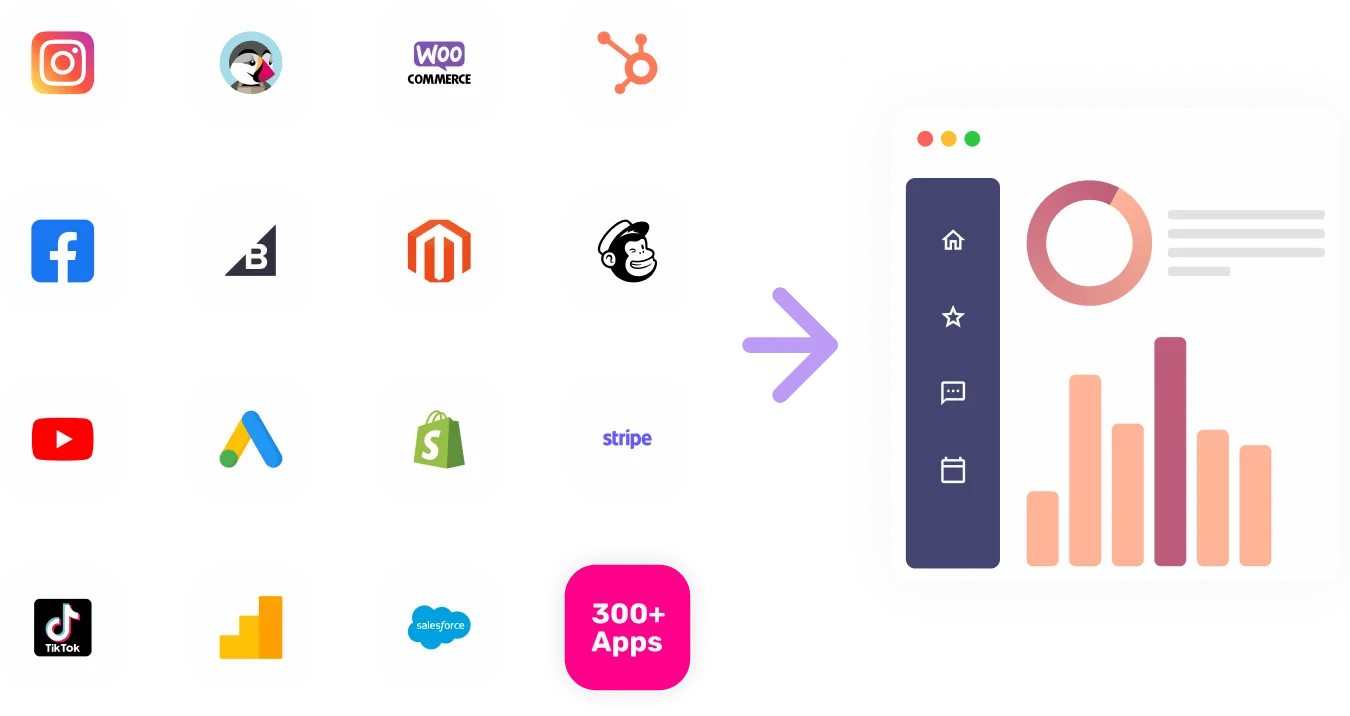
Visualize Your Autodesk BIM 360 channel data with Growth Nirvana's Autodesk BIM 360 Connector
By leveraging the data connector, construction professionals can streamline communication, collaborate more effectively, and make data-driven decisions to optimize project outcomes. It provides a comprehensive view of key performance indicators, project progress, and financial metrics, empowering teams to proactively address issues and drive efficiency across all stages of construction projects.
FAQs
What are the most popular metrics in Autodesk BIM 360 to analyze?
Project Progress Tracking: Monitor the status and milestones of each project phase, ensuring timely completion and quality outcomes.
Cost Analysis: Track project expenses, budget allocation, and cost variances to optimize financial performance and resource utilization.
Safety Compliance Monitoring: Evaluate safety protocols, incidents, and compliance measures to maintain a secure work environment and mitigate risks.
Resource Utilization: Analyze the utilization rates of labor, equipment, and materials to enhance productivity and resource allocation.
Document Management Efficiency: Assess document workflows, revisions, and approvals to streamline processes and mitigate errors.
Why analyze Autodesk BIM 360?
Real-time Decision Making: By analyzing project data in real-time, teams can make informed decisions promptly to address challenges and capitalize on opportunities.
Enhanced Collaboration: Access to shared data and insights fosters collaborative efforts among team members, subcontractors, and stakeholders for improved project outcomes.
Performance Optimization: Identifying key metrics and trends enables organizations to optimize performance, reduce costs, and enhance overall project efficiency.
Risk Mitigation: Proactively monitoring project metrics and compliance indicators helps in identifying and mitigating risks early on, ensuring project success and safety.
Data-Driven Innovation: Harnessing data analytics and visualization tools allows for innovative solutions, process improvements, and strategic planning in construction projects.
