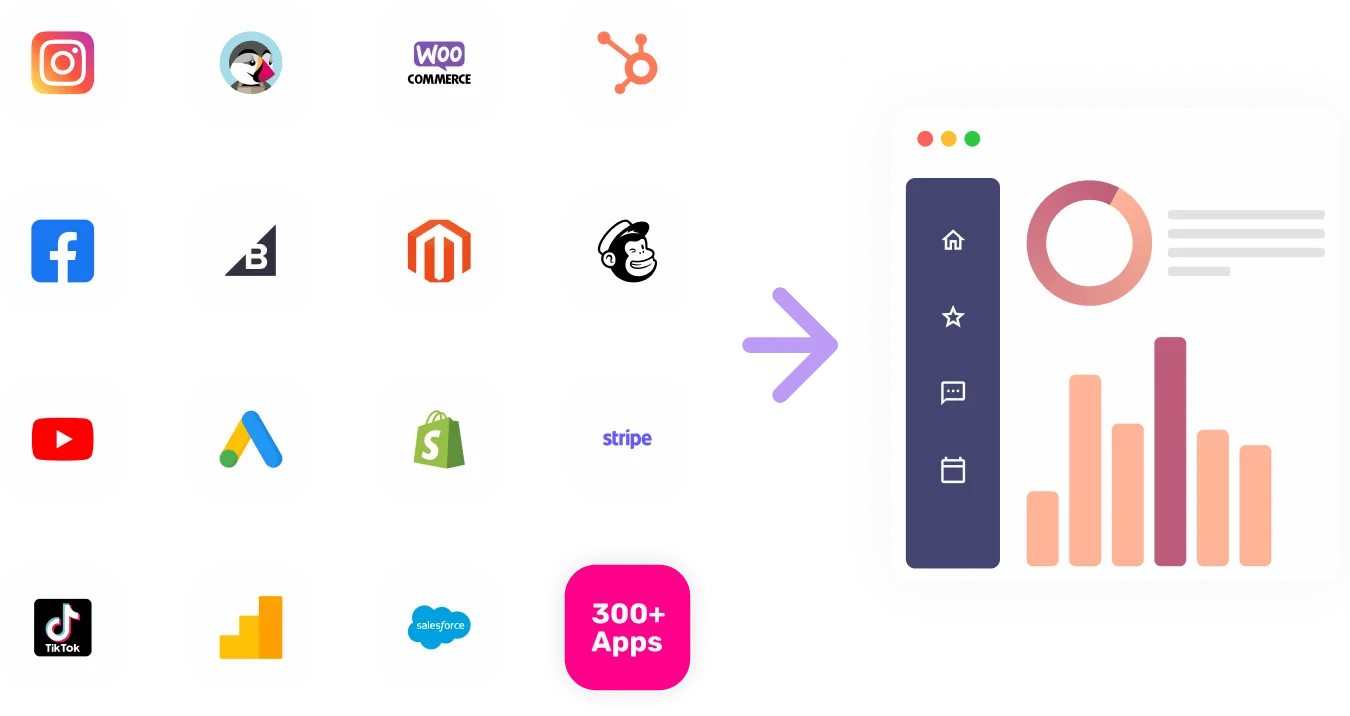

Sync Appcues to Power BI
The Appcues Data Connector is a powerful tool that allows you to integrate and analyze your engineering app data seamlessly. With this connector, you can gain deep insights into user behavior, monitor key metrics, and optimize your app's performance.


Visualize Your Appcues channel data with Growth Nirvana's Appcues Connector
By connecting your engineering app to the Appcues platform, you unlock a world of possibilities. This data connector enables you to capture and analyze various user interactions, such as feature usage, session duration, and custom events. With this deeper understanding of your users' behavior, you can make data-driven decisions to improve user experience, increase engagement, and drive overall app success.
FAQs
What are the most popular metrics in Appcues to analyze?
Feature Usage: Track the usage of specific features within your engineering app to identify popular functionalities and areas of improvement.
Session Duration: Measure the average duration of user sessions to determine overall app engagement and user satisfaction.
Custom Events: Capture and analyze custom events within your app, such as button clicks or form submissions, to gain deeper insights into user actions and behaviors.
Why analyze Appcues?
Improving User Experience: By analyzing the data from your engineering app, you can identify areas where users are encountering difficulties or frustrations. With this knowledge, you can make targeted improvements to enhance user experience and increase satisfaction.
Optimizing Performance: Understanding which features are most popular and how users interact with your app allows you to optimize its performance. By focusing on high-impact improvements, you can make your engineering app more efficient and effective.
Driving Innovation: By analyzing user behavior and key metrics, you can uncover patterns and trends that may inspire innovative solutions. This analysis may lead to new features, improved workflows, or entirely new app functionalities that can help differentiate your engineering app in the market.
